 01
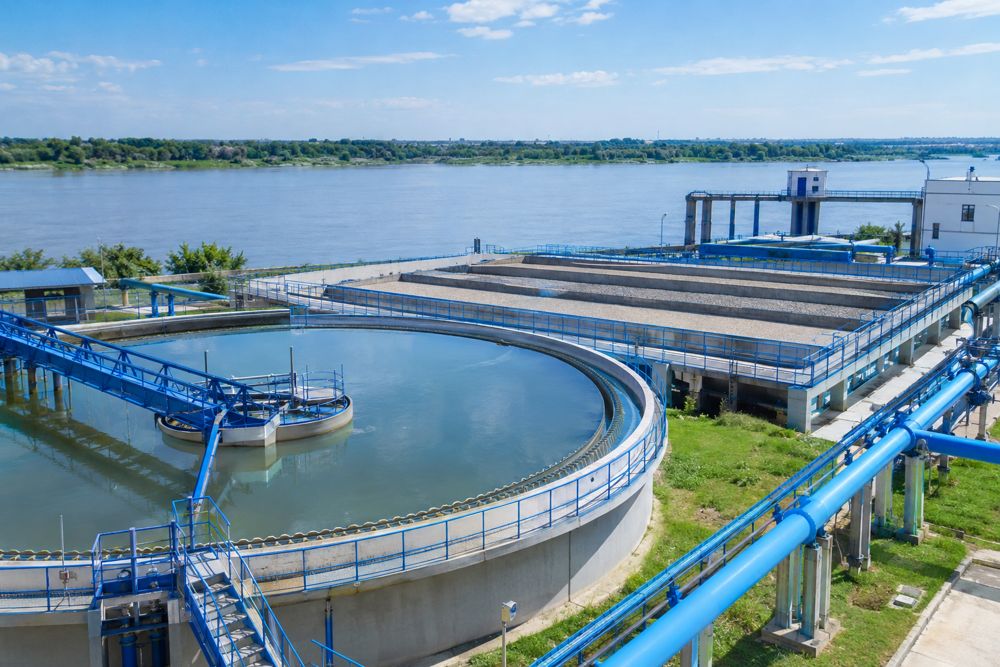
Water Treatment Plants
Municipal & industrial WTPs
Raw-water to clear-water monitoring of coagulation, filtration and disinfection, with filter and backwash performance.
WTP | DESALINATION | STP | ETP | ZLD
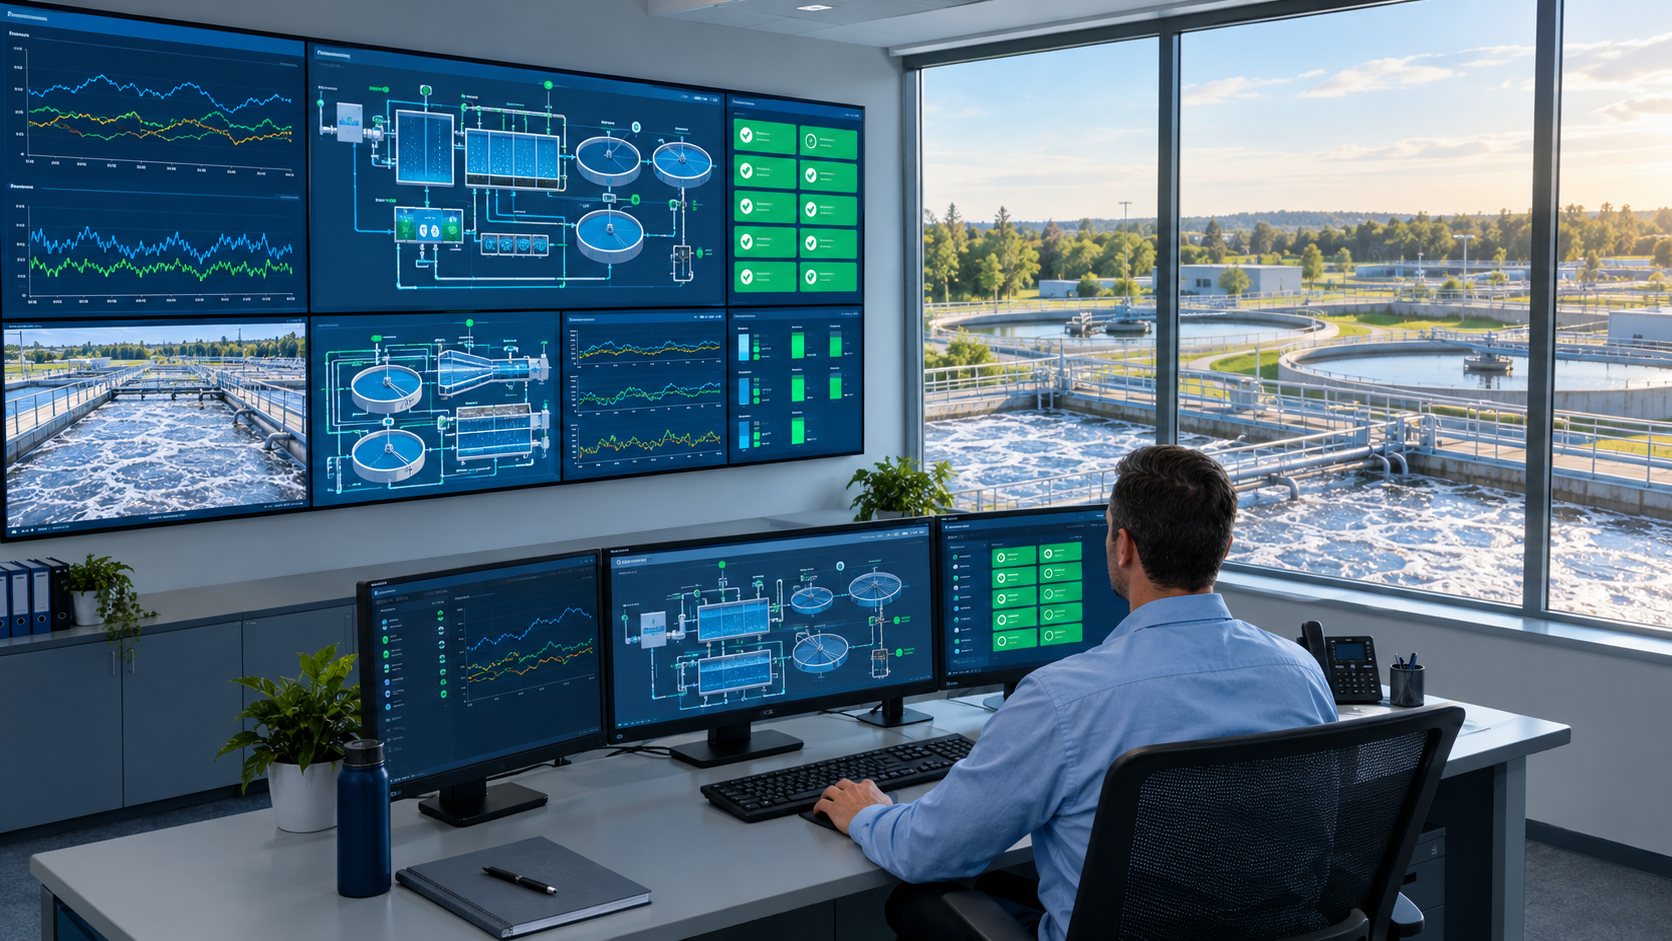
Real-time, verifiable monitoring for water treatment plants, desalination plants, sewage and effluent treatment plants across India and the Middle East. Wateria connects sensors and PLCs to a secure industrial IoT cloud platform that turns every reading into live dashboards, alerts, tracked corrective actions and audit-ready compliance reports.
Site Survey · Automation · IoT Data Logger · Cloud Platform · Alerts & Tasks · Compliance Reporting
EVERY PLANT ONLINE, EVERY READING ACCOUNTED FOR
WHY CONTINUOUS MONITORING
Periodic sampling only shows the moment the sample was taken. Continuous data captures the whole day, including night-time shutdowns, peak loads and slow drift that a monthly visit can miss.
Illustrative profile, not measured data.
Blowers switched off to save power leave no trace in a daytime sample.
Energy draw, equipment run-hours and dissolved oxygen move together only when treatment is really happening. A plant cannot fake all three.
One connected sensor logging every 15 minutes adds more than 35,000 readings per parameter a year.
APPLICATIONS
The same IoT platform is configured for each plant's process, consent conditions and reporting needs, from a small housing-society STP to a municipal water treatment plant or a seawater desalination plant.
01Municipal & industrial WTPs
Raw-water to clear-water monitoring of coagulation, filtration and disinfection, with filter and backwash performance.
 02
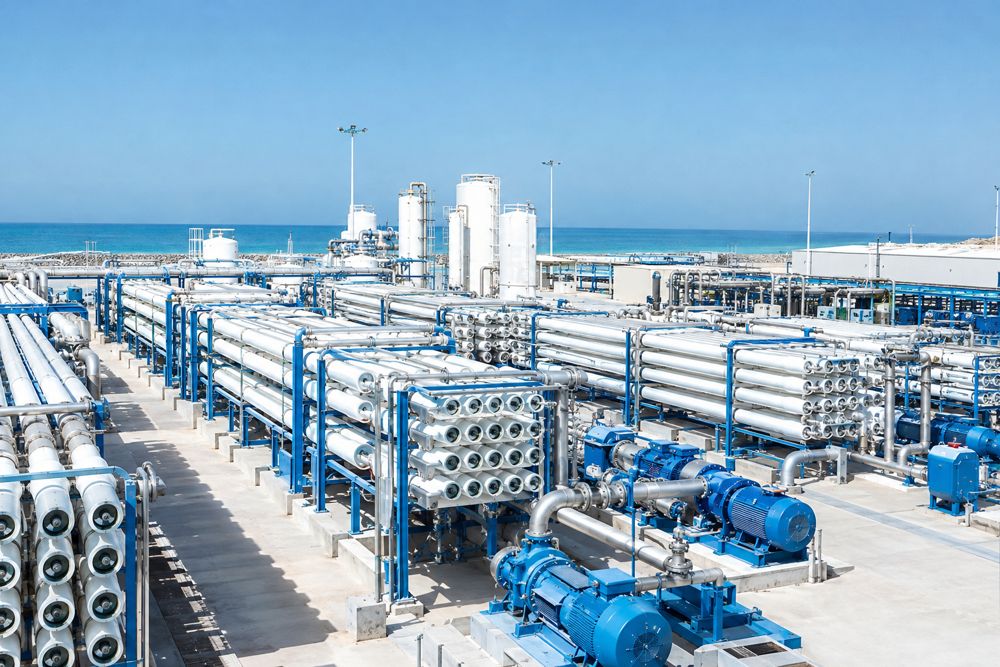
SWRO & BWRO
Pre-treatment, RO train and product-water quality, with energy per cubic metre and early warning of membrane fouling.
 03
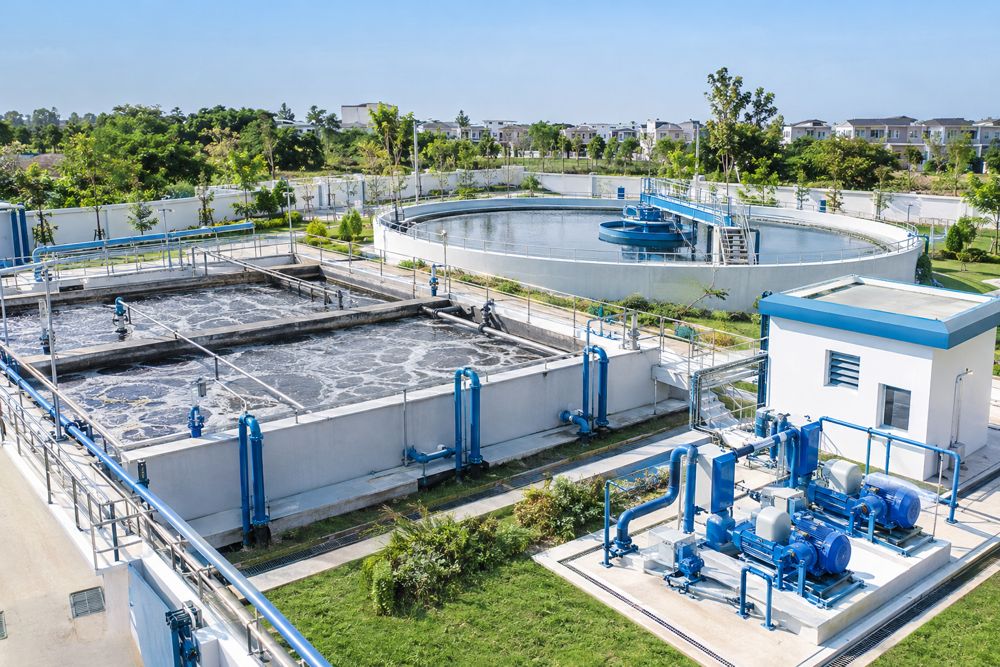
Hotels, hospitals, housing, townships
Proof that the biological process actually ran, plus outlet quality against the consent limits for every hour of the day.
 04
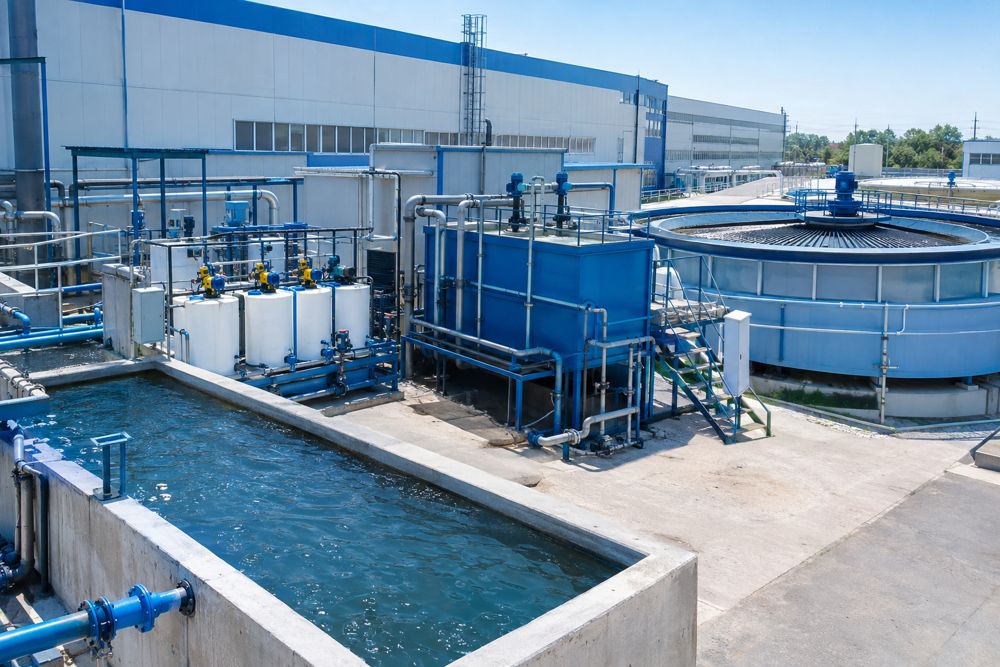
Industrial ETPs & CETPs
Continuous effluent quality and flow, analyser health and data connectivity for online monitoring requirements.
 05
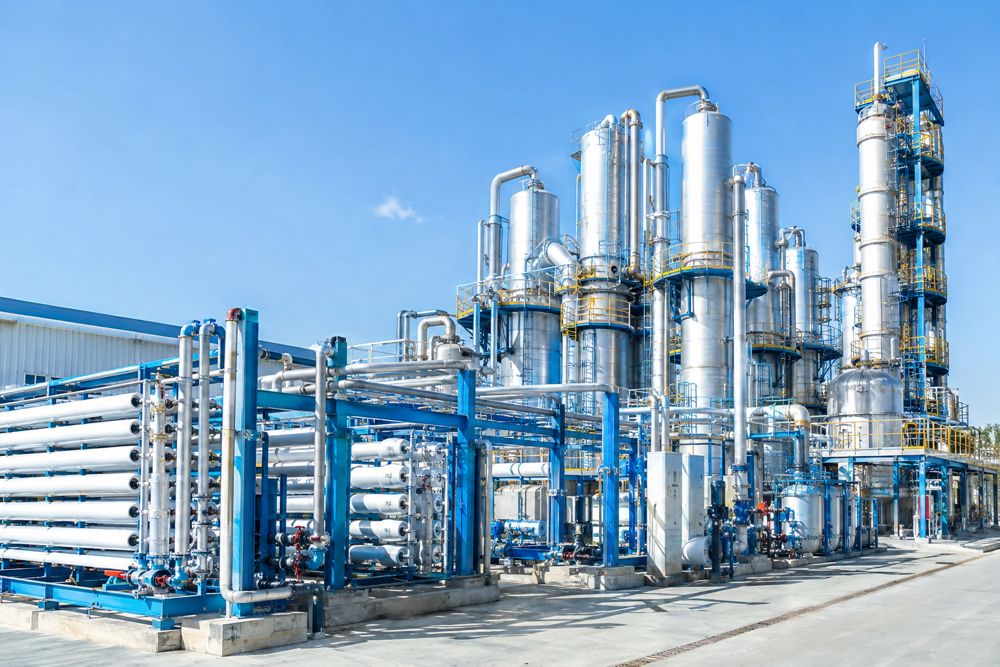
RO, MEE & ATFD
Recovery, reject handling and evaporator performance, so zero discharge is shown with data, not just declared.
 06
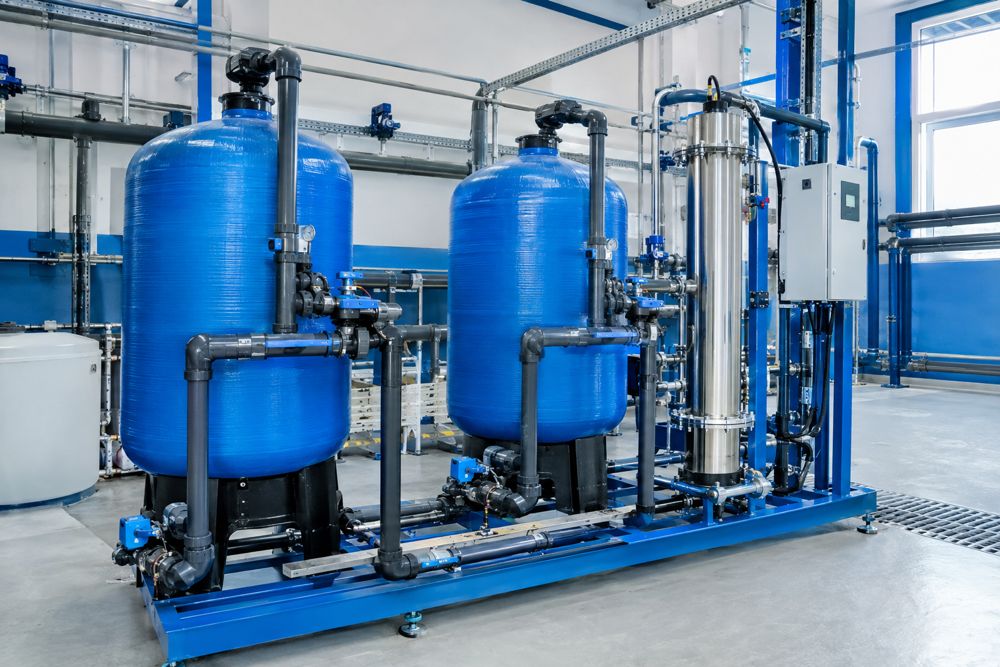
Treated water for flushing, irrigation, cooling
Quality checks on treated water before it is reused, with volumes recycled tracked for water-saving reports.
 07
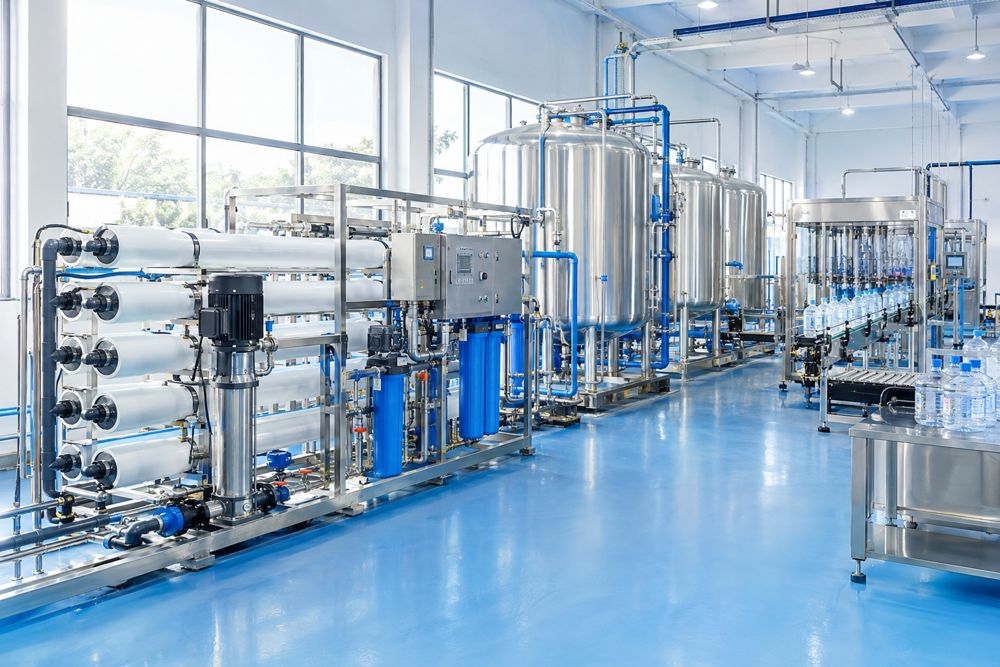
Packaged RO, softeners, UV
Product-water quality, UV lamp health, cartridge and membrane condition for hotels, hospitals and industries.
 08
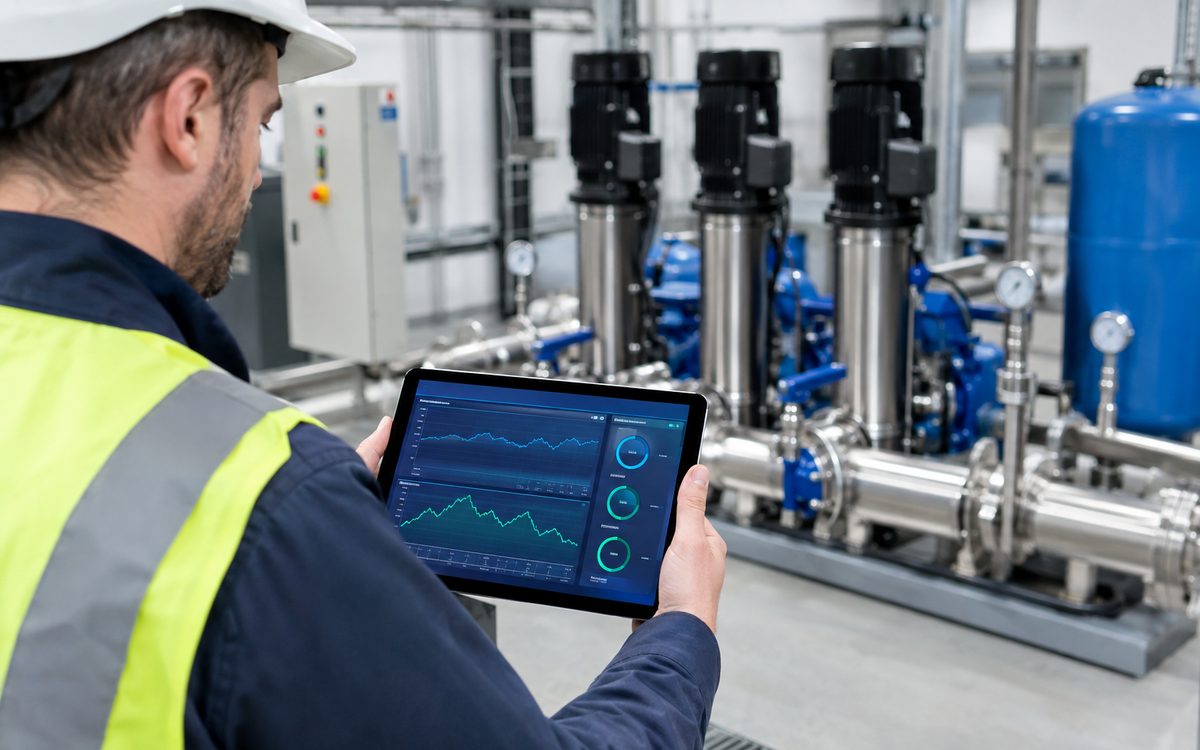
Sumps, tanks, booster stations
Tank and sump levels, pump run-hours and power failures, with overflow and dry-run alerts across many sites.
HOW IT WORKS
Sensors → PLC → IoT data logger → Cloud → People
If the plant already has a PLC, an IoT data logger reads it over standard industrial protocols such as Modbus and the plant is typically live within days. Control logic stays untouched; only data flows out. Manual plants are first automated with a PLC panel, motor starters and essential sensors, typically in 2 to 4 weeks. Timelines are confirmed after a site survey.
Book a Site Survey →PATH B · CONNECT (PLC ON SITE)
PATH A · AUTOMATE + CONNECT (MANUAL PLANT)
PLATFORM FEATURES
Each module serves the plant's day-to-day operation and its compliance at the same time. Pick a plant type to see the kind of live view your team gets.
EQUIPMENT
ALERTS & TASKS
Illustrative mock-up and data. Limits are configured per each plant's consent conditions.
MODULE 01
One live view of flows, DO, pH, blowers, pumps and energy. Automatic daily and monthly compliance reports replace paper logbooks.
MODULE 02
Start, stop or adjust blowers, pumps and dosing from a phone and recover from trips in minutes. Every command is audit-logged.
MODULE 03
Chlorine, polyelectrolyte, antiscalant, filters and spares tracked, with alerts before a stock-out stops treatment.
MODULE 04
Out-of-range readings automatically create tasks with SOP checklists, so every alert ends in a documented corrective action.
MODULE 05
Every fault logged with severity, owner and fix-time SLA, building a breakdown history that separates genuine failures from neglect.
MODULE 06
Learns each plant's normal pattern, flags anomalies before they become failures or violations, and answers plain-language questions.
WHAT WE MEASURE
Discharge and product-water quality show the result. Process signals such as dissolved oxygen, run-hours and energy prove the plant was genuinely operated. Instrumentation is scaled to plant size, risk and consent conditions.
| Parameter | Why It Matters | WTP | Desalination | STP | ETP | ZLD |
|---|---|---|---|---|---|---|
| Inlet & Outlet Flow | Load vs capacity; bypass detection by mass balance | ● | ● | ● | ● | ● |
| pH | Treatment stability; corrosive discharge | ● | ● | ● | ● | ● |
| BOD / COD / TSS | Organic load and solids in the discharge | – | – | ● | ● | ○ |
| Total N / Ammonia | Nutrient load, algal blooms | – | – | ○ | ○ | – |
| Aeration DO | Biological treatment actually running | – | – | ● | ○ | – |
| Turbidity / SDI | Filtration and RO pre-treatment performance | ● | ● | ○ | ○ | ○ |
| Residual Chlorine / UV | Disinfection on-line | ● | ● | ● | ○ | – |
| ORP | Dechlorination before membranes; oxidation control | ○ | ● | ○ | ○ | ○ |
| Conductivity / TDS | Salinity, membrane health, product water quality | ○ | ● | ○ | ● | ● |
| RO Pressures & Recovery | Fouling, scaling and energy efficiency | ○ | ● | – | ○ | ● |
| Evaporator Steam & Condensate | MEE / ATFD performance in zero discharge | – | – | – | – | ● |
| Tank & Sump Levels | Overflow and spill risk | ● | ● | ● | ● | ● |
| Blower / Pump Status & Energy | Proof of operation; downtime record | ● | ● | ● | ● | ● |
| Chemical Stock & Dosing | Consumption against treated flow | ● | ● | ● | ● | ● |
| Mains & DG Power | Power failures and downtime with reason | ● | ● | ● | ● | ● |
Indicative guide. Enforceable limits are those in each plant's consent or permit, and the platform is configured to them. Online BOD, COD and TSS analysers are fitted where specified by consent conditions or plant size; other parameters are verified by laboratory analysis.
SMART ALERTS
Alert classes are aligned to CPCB's revised online monitoring alert protocol (exceedance, stuck values and connectivity), plus operational evidence that shows whether a plant is really running.
| Trigger | Detection Logic (Indicative) | Immediate Response | Alert Class |
|---|---|---|---|
| Discharge exceedance | Outlet pH, BOD, COD or TSS beyond the consent limit, sustained for 15 minutes | Owner and Wateria alerted; corrective task created automatically | Exceedance |
| Suspected bypass | Discharge flow while blowers or pumps are off, or inlet–outlet imbalance beyond tolerance | High-priority flag to owner and Wateria | Operational |
| Plant not operating | Blower off for more than 30 minutes in operating hours, or aeration DO below 0.5 mg/L for 2 hours | Operator alert; escalates if unresolved | Operational |
| Disinfection failure | Residual chlorine below set-point, or UV lamp fault | Alert plus chemical stock check | Exceedance |
| Membrane fouling | Normalised permeate flow falling or differential pressure rising beyond the baseline | Cleaning task scheduled before output or quality drops | Operational |
| Overload / overflow | Inlet flow above design capacity, or sump level above 90% | Alert; peak-load report | Operational |
| Power / DG failure | Mains lost and DG not running within 10 minutes | Alert; downtime logged with reason | Operational |
| Stuck or implausible signal | Reading unchanged beyond tolerance for 4 hours, or outside physical range | Data-integrity flag; calibration task | Stuck value |
| Device offline | No data received for 60 minutes | Owner and Wateria alerted; status visible on the compliance view | Connectivity |
| Calibration due / tamper | Calibration overdue, or sensor or panel disconnected | Task plus audit-log entry | Data integrity |
Thresholds and timings are indicative; final values are set per each plant's consent conditions and agreed with the plant owner and, where required, the regulator.
ALERT-TO-ACTION WORKFLOW
Every reading is checked against consent limits and data-integrity rules.
Owner, operator and Wateria are alerted at once.
A task or ticket is raised with owner, severity and SLA.
Remote restart or field visit; spares and chemicals checked.
Closes only when readings return within limits, with photos and notes.
Event, duration, action and closure time recorded in the compliance ledger.
ESCALATION (INDICATIVE)
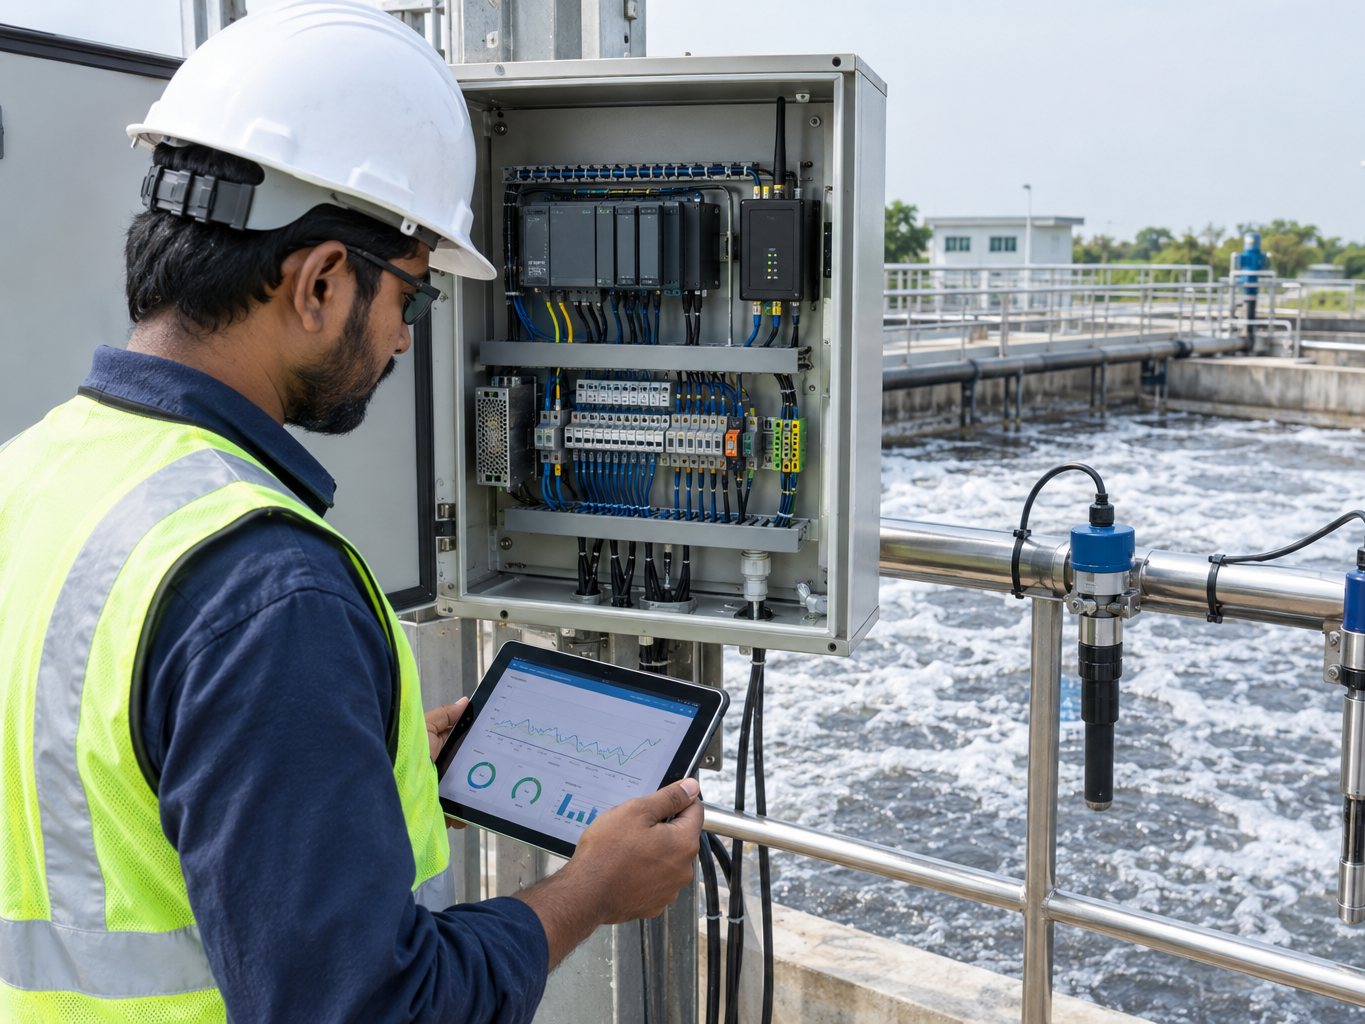
Advantages of Wateria IoT Monitoring
Early warnings catch drift before it becomes a violation.
Energy, run-hours and DO logged 24×7.
Up to 40% lower opex and 60% manpower efficiency.*
AI flags anomalies before failures.
For consent renewals and inspections.
Fewer emergency site visits.
*Platform benchmarks; actual results vary by site.
REGULATORY ALIGNMENT
Regulators are moving from grab samples to continuous data and exception-based enforcement. The platform is configured to the rules that apply to each plant, in India and across the Middle East.
INDIA
Discharge limits are configured to each unit's Consent to Operate (CTO).
MIDDLE EAST
ENVIRONMENTAL COMPLIANCE SERVICES
Beyond monitoring, Wateria supports plant owners across the full environmental compliance cycle in India and the Middle East, from consents and permits to audits, upgrades and day-to-day operation.
CTE / CTO applications, renewals and amendments with State Pollution Control Boards, and environmental permit support in the Middle East. Consent conditions and validity tracked.
Analysers, data loggers and data connectivity to CPCB / SPCB servers where required, with calibration as per protocol.
Monthly compliance reports, consent-condition tracking, annual returns and environmental statements prepared from verified data.
Scheduled sampling and analysis through accredited laboratories, with results logged alongside the online data.
Audits of STPs, ETPs, WTPs and desalination plants, with gap analysis against consent limits and a practical action plan.
STP, ETP and ZLD design, build and retrofits, including tertiary treatment, disinfection and automation, to meet stricter norms.
Evidence packs for inspections and documented responses to regulator queries, drawn from the audit trail.
Day-to-day plant operation, trained operators, scheduled calibration and a 24-hour emergency service.
ENGAGEMENT MODELS
Owners pay a one-time connection and a monthly platform subscription. Owners own their data and can export it at any time.
CONNECT
Typically live within days
AUTOMATE + CONNECT
Typically 2–4 weeks
ASSURE · MOST COMPLETE
One contract, one SLA, one helpdesk
TRUST & DATA INTEGRITY
The plant owner owns the data. Regulators can be given continuous, read-only access.
Time-stamped readings, stuck-value and out-of-range detection, and calibration logs.
Every remote command, threshold change and task closure is logged with user and time.
Encrypted data transfer, role-based access and enterprise-grade cloud infrastructure.
24/7 platform with 99.9% reliability; offline devices are flagged within the hour.
Open data export and API for regulator and corporate systems; no lock-in.
HOW WE DELIVER
Process, existing PLC and sensors, consent conditions and connectivity.
Connect or Automate + Connect path, sensors and analysers selected.
Panel, data logger and sensors installed, calibrated and tested.
Limits, alert classes, escalation, users and report formats.
O&M desk, calibration schedule and monthly compliance reports.
Continuous, verifiable compliance for your WTP, desalination plant, STP or ETP.
Share the plant type and capacity, whether a PLC is installed, and your consent or permit conditions. Our team will plan a site survey and send a techno-commercial proposal for monitoring and environmental compliance services.